

Choosing the right place to live and work is essential in today’s job market. PayrollPrices.com is pleased to present the Employee Location Index 2025, ranking 80 UK towns and cities based on key factors affecting workers and job-seekers.
This report offers valuable insights for business owners, policy makers, and other stakeholders. The findings highlight regions that excel in providing balanced, fulfilling work environments, helping to inform decisions on business locations, workforce development, and policy initiatives. This report aims to guide efforts to enhance employee satisfaction and attract talent to the most favourable locations.
Our study evaluates factors including salary, commute time, median working hours, contentment scores and availability of employment local opportunities. These metrics provide a clear picture of each location’s suitability for a balanced and rewarding lifestyle.
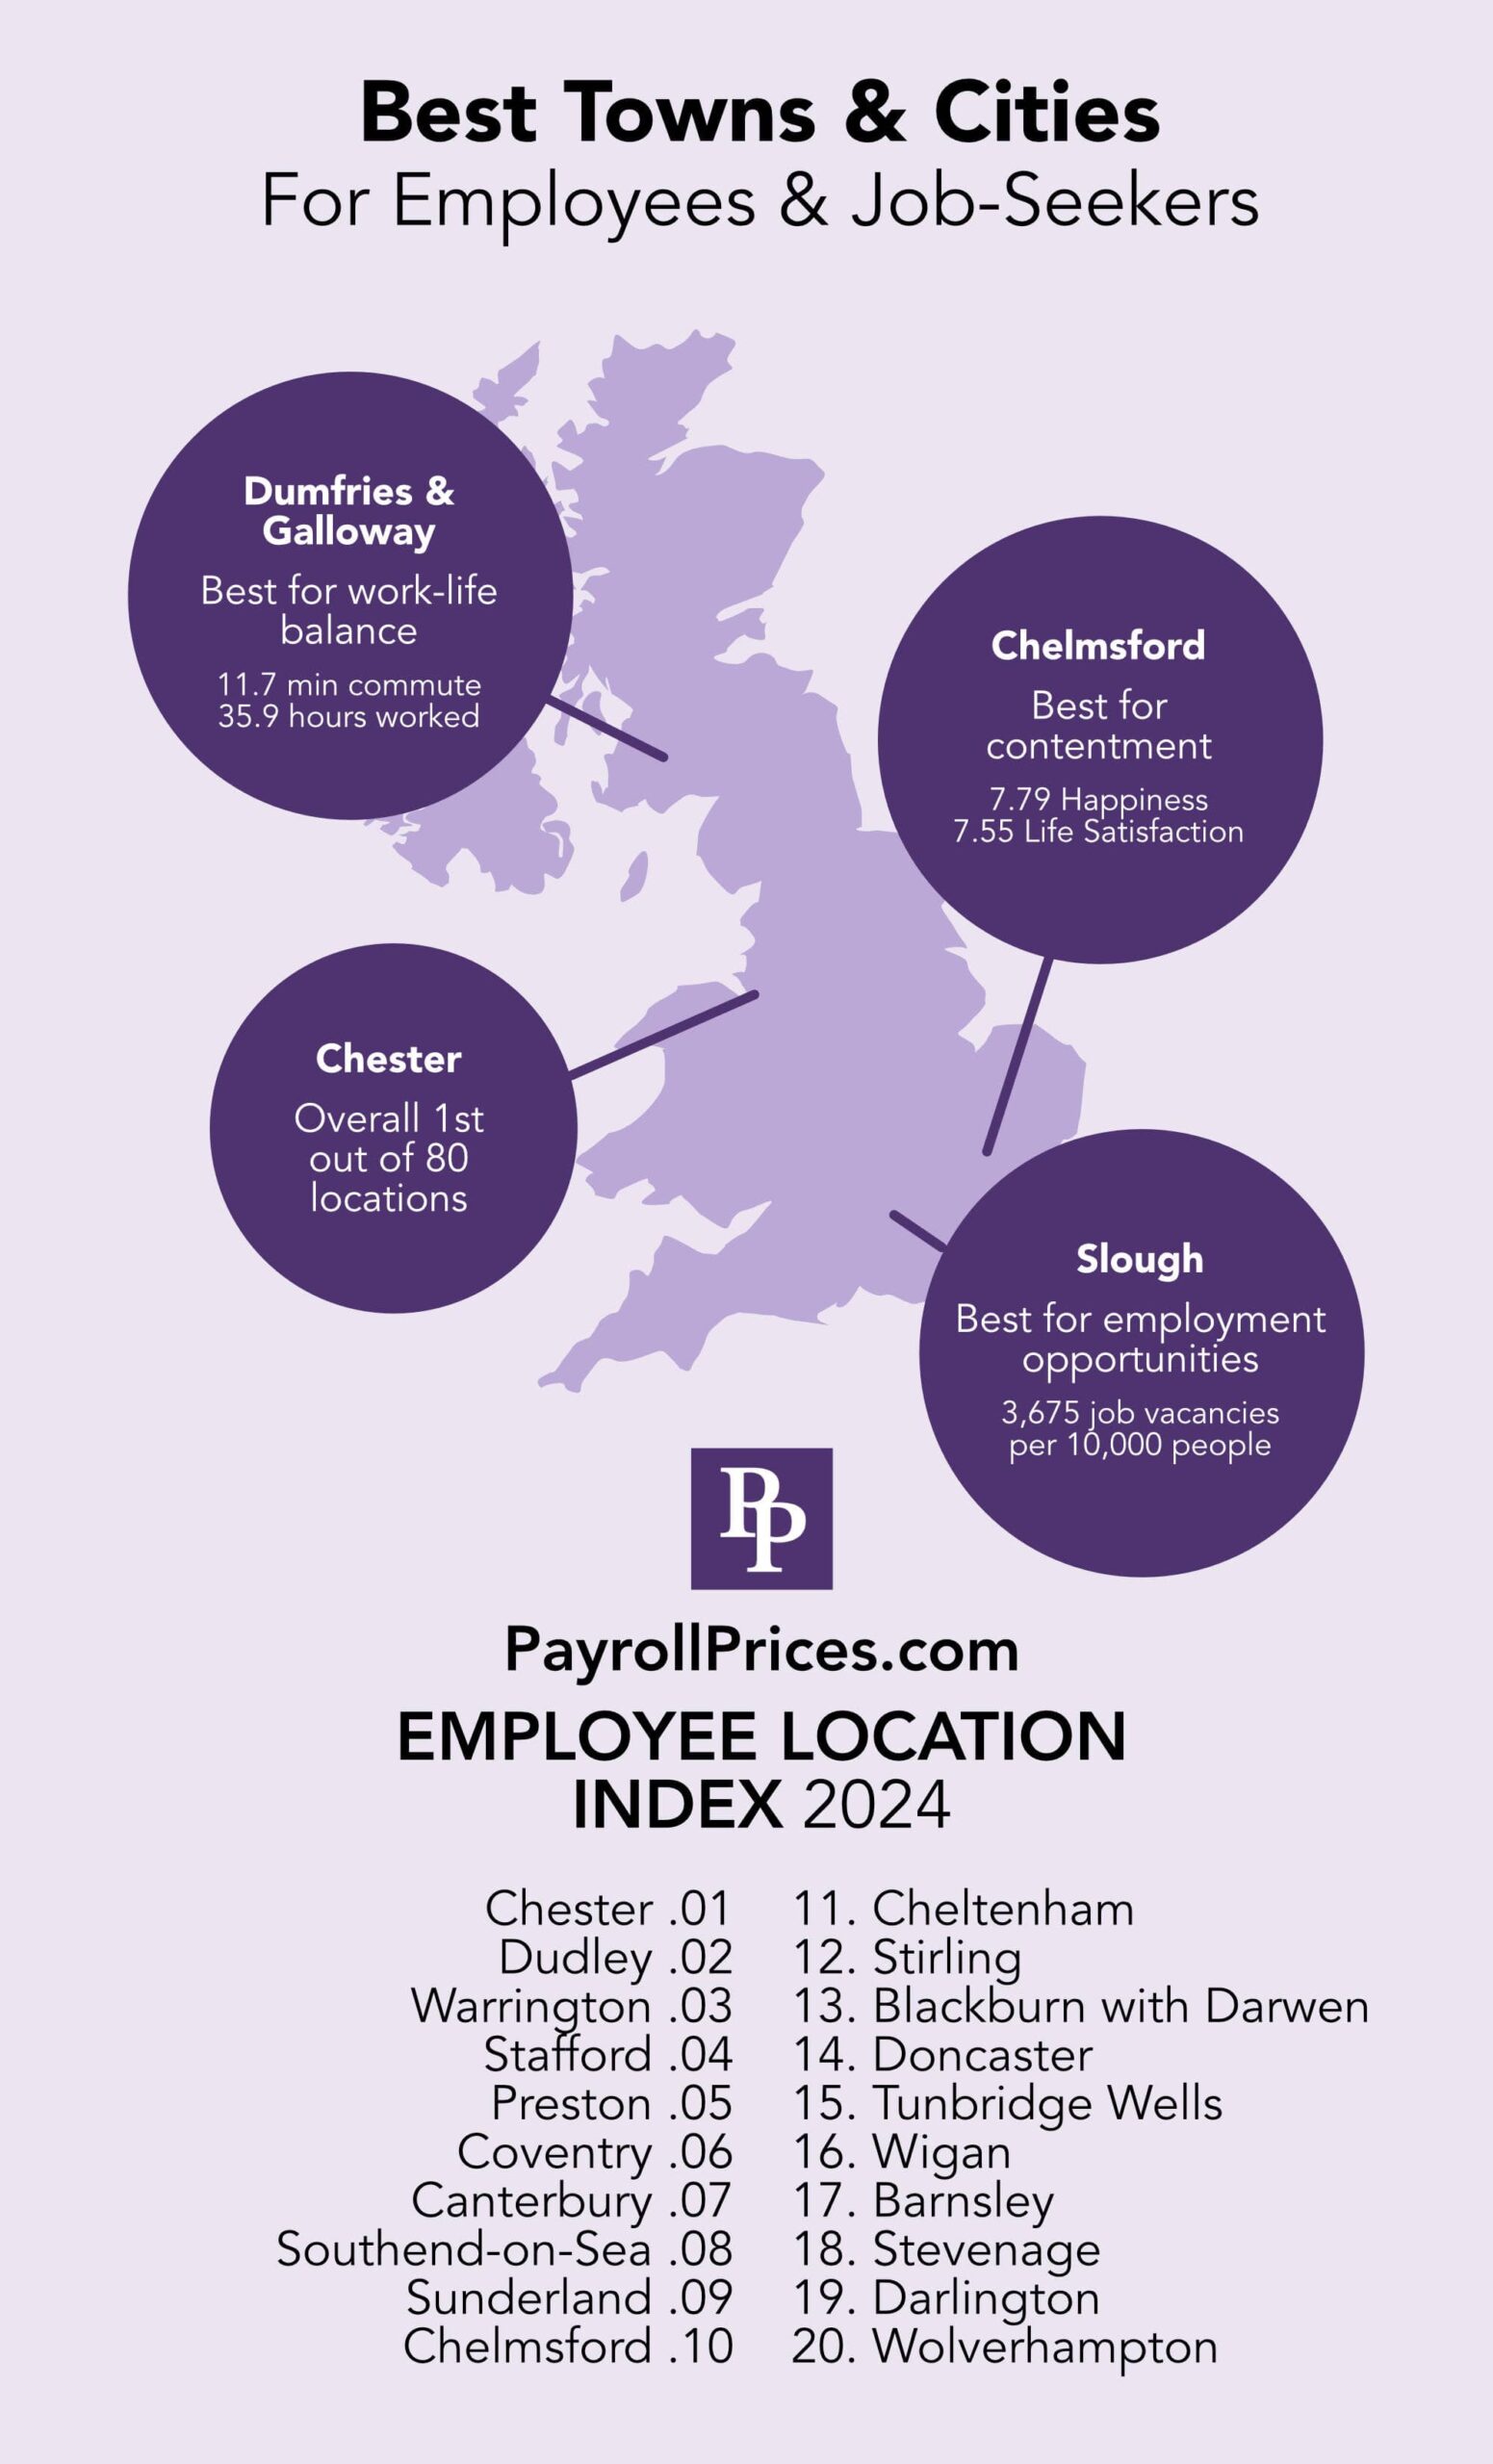
Leading the top locations are Chester, Dudley, and Warrington, followed by Stafford, Preston, and Coventry. Each of these locations stands out for their strong combination of job opportunities and quality of life.
Explore the Employee Location Index 2025 to discover what the top 80 towns and cities have to offer.
Key findings
- London ranks 80th out of 80: Despite its high median salary, London’s high living costs and long commute times significantly impact its overall ranking.
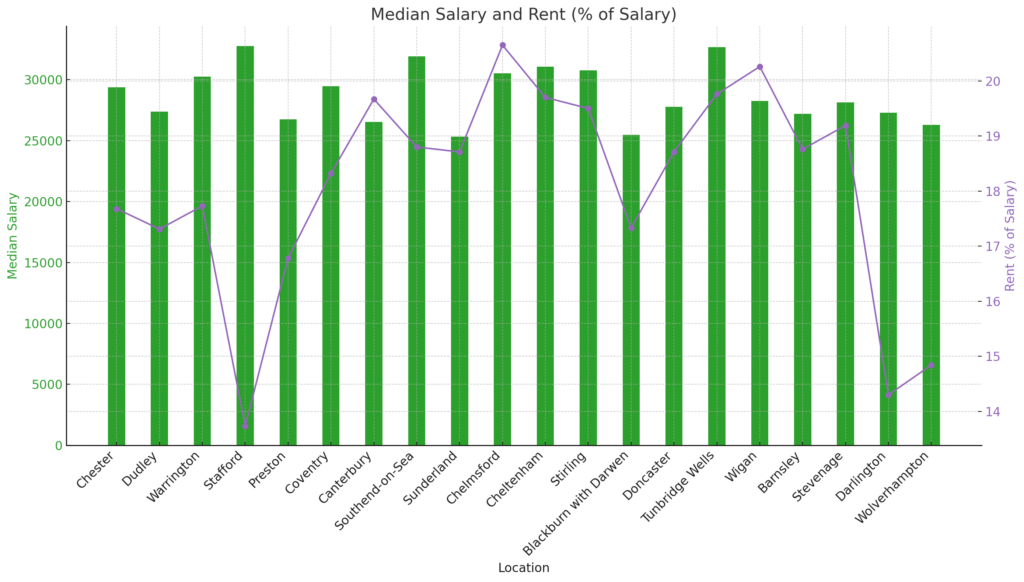
- High salaries vs. cost of living: Locations like Chester and Warrington offer competitive salaries with more manageable rent costs, providing better financial balance for workers.
- Work-life balance in smaller cities: Chester, Tunbridge Wells, and Stirling excel in providing a good balance of reasonable working hours and short commute times, contributing to higher happiness and life satisfaction scores.
- Affordable living: Dudley and Barnsley are notable for their low rent percentages relative to salary, making them attractive options for workers seeking to maximize disposable income.
- Vibrant job markets: Wigan and Dudley lead with the highest number of job vacancies per 10,000 people, indicating strong local job markets.
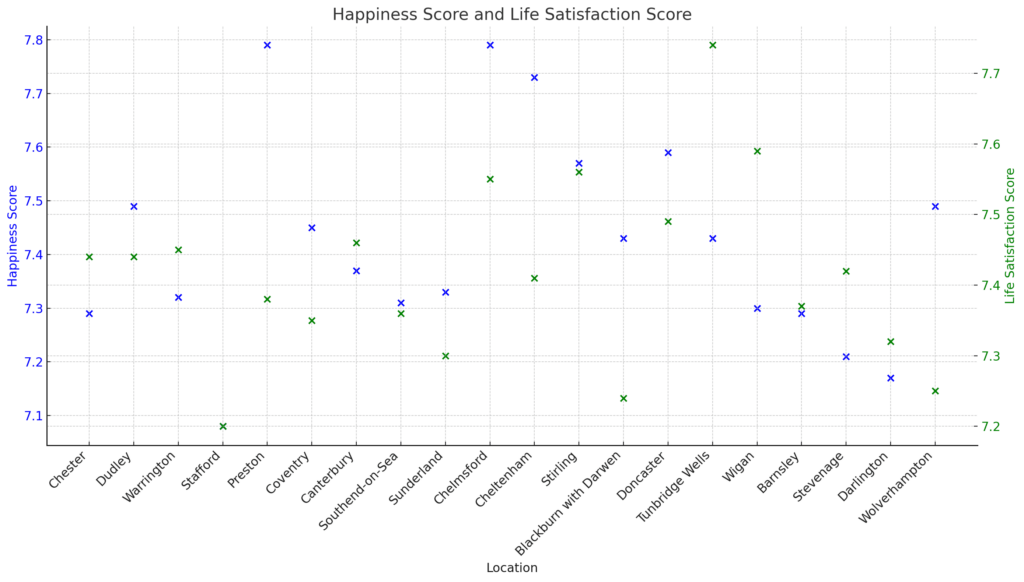
- High happiness and life satisfaction: Chelmsford and Cheltenham boast some of the highest happiness and life satisfaction scores, suggesting high overall well-being among residents.
- Short commute times: Locations such as Milton Keynes and Darlington offer some of the shortest median commute times, enhancing work-life balance.
- Overall well-being: Preston and Dumfries and Galloway show high scores in happiness and life satisfaction, indicating strong community well-being.
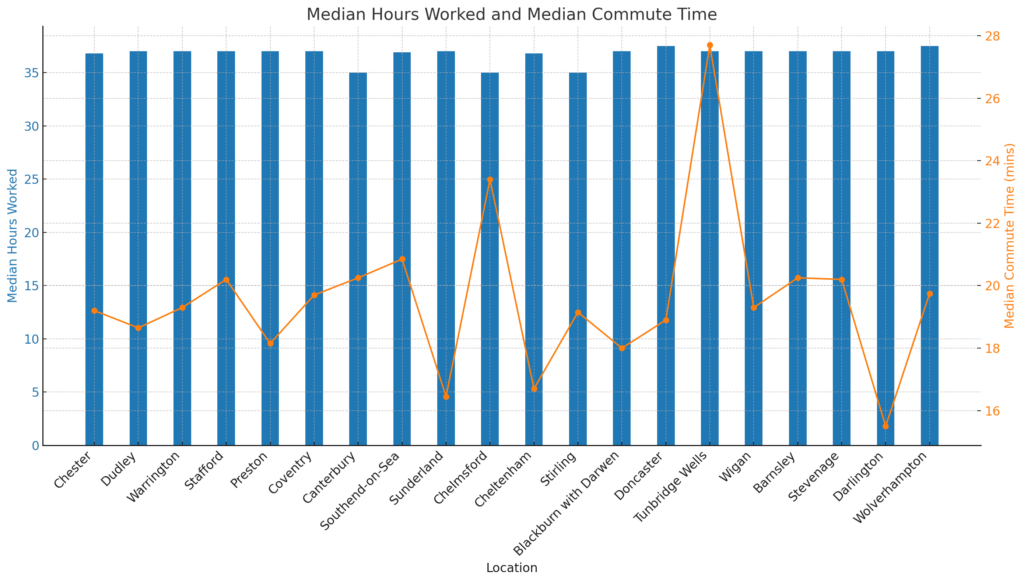
- Median working hours: Most top-ranking locations maintain a median of around 37 hours worked per week, balancing work demands with personal time.
- Economic opportunity and quality of life: The North West of England, with cities like Chester and Warrington, consistently ranks high due to a combination of economic vitality and high quality of life.
The top 20 UK towns and cities for employees and job-seekers
The Employee Location Index 2025 has identified the top 20 best towns and cities for UK workers and job-seekers, highlighting locations that offer a balanced mix of economic opportunities and quality of life.
- Chester
- Dudley
- Warrington
- Stafford
- Preston
- Coventry
- Canterbury
- Southend-on-Sea
- Sunderland
- Chelmsford
- Cheltenham
- Stirling
- Blackburn with Darwen
- Doncaster
- Tunbridge Wells
- Wigan
- Barnsley
- Stevenage
- Darlington
- Wolverhampton
10 best locations for employment opportunities
Employment opportunities are a critical factor for job-seekers when choosing where to live. The number of job vacancies per 10,000 inhabitants is a key indicator of a vibrant job market. Here are the 10 best locations for employment opportunities.
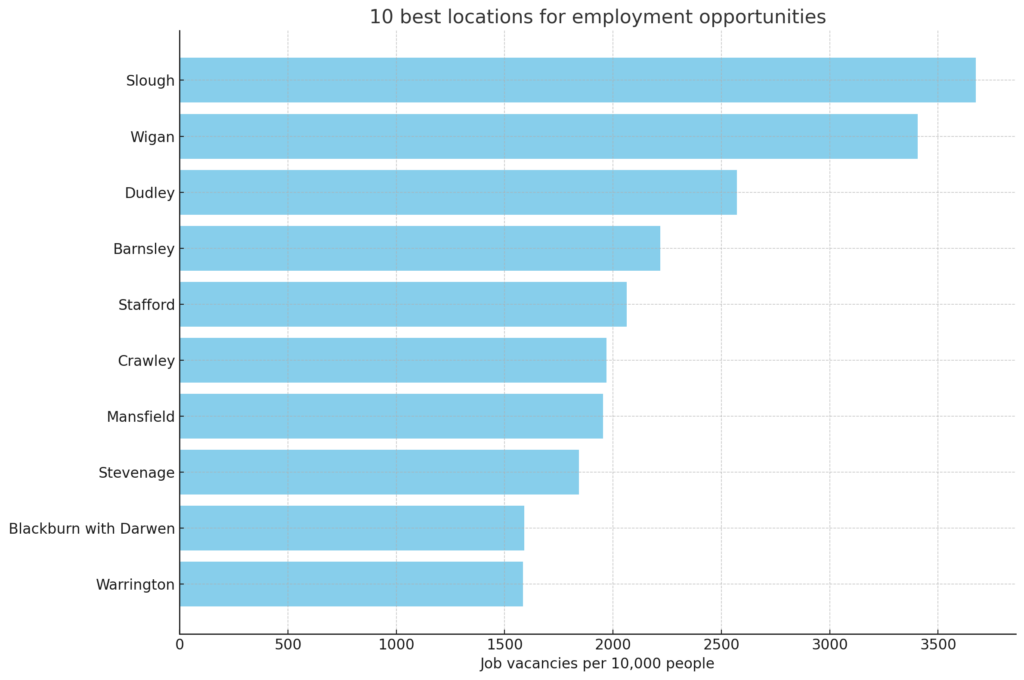
- Slough – 3674.75 job vacancies per 10,000 people
- Wigan – 3406.59 job vacancies per 10,000 people
- Dudley – 2571.65 job vacancies per 10,000 people
- Barnsley – 2217.35 job vacancies per 10,000 people
- Stafford – 2062.49 job vacancies per 10,000 people
- Crawley – 1970.63 job vacancies per 10,000 people
- Mansfield – 1953.03 job vacancies per 10,000 people
- Stevenage – 1842.07 job vacancies per 10,000 people
- Blackburn with Darwen – 1591.29 job vacancies per 10,000 people
- Warrington – 1583.76 job vacancies per 10,000 people
10 best locations for work-life balance
Work-life balance is crucial for overall well-being, and it can be significantly influenced by factors such as commute time and working hours. Here are the 10 best locations for work-life balance, based solely on these factors.
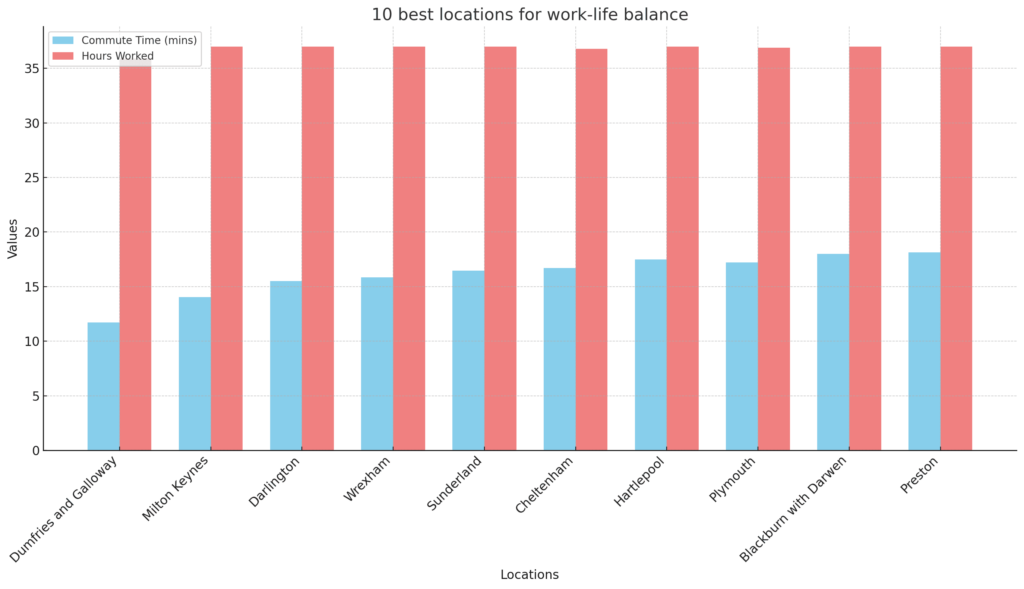
- Dumfries and Galloway
- Median commute time: 11.7 minutes
- Median hours worked: 35.9 hours
- Milton Keynes
- Median commute time: 14.05 minutes
- Median hours worked: 37 hours
- Darlington
- Median commute time: 15.5 minutes
- Median hours worked: 37 hours
- Wrexham
- Median commute time: 15.85 minutes
- Median hours worked: 37 hours
- Sunderland
- Median commute time: 16.45 minutes
- Median hours worked: 37 hours
- Cheltenham
- Median commute time: 16.7 minutes
- Median hours worked: 36.8 hours
- Hartlepool
- Median commute time: 17.5 minutes
- Median hours worked: 37 hours
- Plymouth
- Median commute time: 17.2 minutes
- Median hours worked: 36.9 hours
- Blackburn with Darwen
- Median commute time: 18 minutes
- Median hours worked: 37 hours
- Preston
- Median commute time: 18.15 minutes
- Median hours worked: 37 hours
10 best locations for employee contentment
Employee contentment is crucial for maintaining productivity and overall well-being. It can be gauged through happiness and life satisfaction scores. Here are the 10 best places for employee contentment based on these scores.
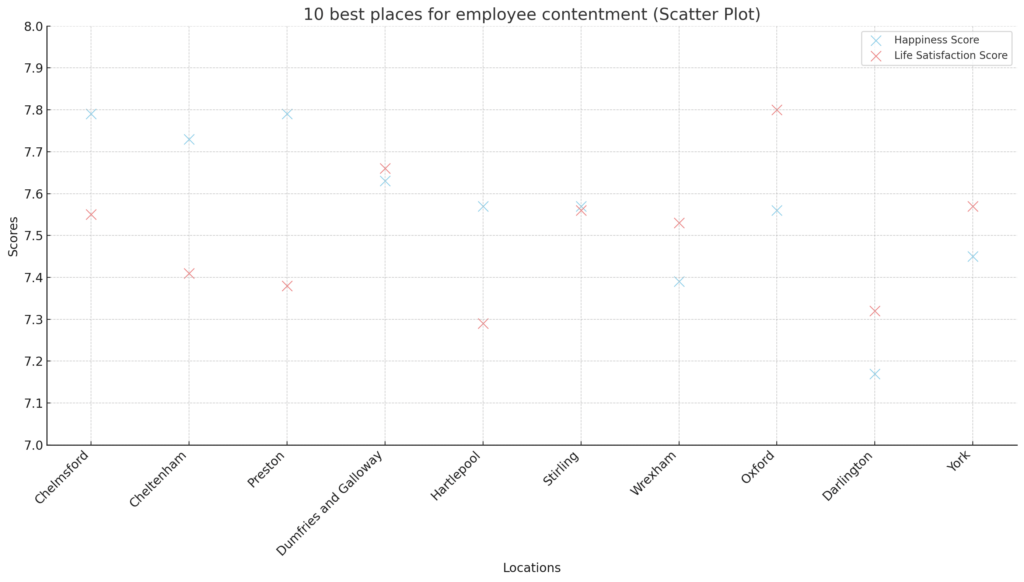
- Chelmsford
- Happiness score: 7.79
- Life satisfaction score: 7.55
- Cheltenham
- Happiness score: 7.73
- Life satisfaction score: 7.41
- Preston
- Happiness score: 7.79
- Life satisfaction score: 7.38
- Dumfries and Galloway
- Happiness score: 7.63
- Life satisfaction score: 7.66
- Hartlepool
- Happiness score: 7.57
- Life satisfaction score: 7.29
- Stirling
- Happiness score: 7.57
- Life satisfaction score: 7.56
- Wrexham
- Happiness score: 7.39
- Life satisfaction score: 7.53
- Oxford
- Happiness score: 7.56
- Life satisfaction score: 7.8
- Darlington
- Happiness score: 7.17
- Life satisfaction score: 7.32
- York
- Happiness score: 7.45
- Life satisfaction score: 7.57
Notable data points
London’s poor performance
While London offers significant economic opportunities and cultural attractions, its high cost of living, long commute times, and competitive job market contribute to a less favourable ranking in the Employee Location Index 2025. For many workers, the trade-offs required to live and work in London outweigh the benefits, leading them to seek better balance and affordability in other UK towns and cities.
High salaries vs. cost of living
London tops the list for median salary at £44,370, significantly higher than other locations. However, it also has the highest median rent as a percentage of salary at 26.91%, indicating a high cost of living that can offset the benefits of higher earnings. In contrast, locations like Chester and Warrington offer relatively high salaries (£29,385 and £30,259 respectively) with more manageable rent costs (17.68% and 17.73%).
Work-life balance
Chester, which ranks first overall, balances a moderate median salary with low commute times (19.2 minutes) and relatively high happiness (7.29) and life satisfaction scores (7.44). This suggests that smaller towns can offer a better work-life balance compared to larger urban areas. Similar patterns are observed in places like Stafford and Stirling, which have short commute times and high life satisfaction scores.
Commute times
Commute times vary widely across the locations. London and Belfast have the longest median commute times (38 and 38.9 minutes, respectively), which can negatively impact overall life satisfaction despite other advantages. On the other hand, Darlington and Milton Keynes enjoy some of the shortest commute times (15.5 and 14.05 minutes), contributing to their appeal.
Job market vibrancy
Dudley and Wigan stand out with very high numbers of job vacancies per 10,000 people (2571.65 and 3406.59 respectively), indicating strong job markets. This is a significant factor for job-seekers prioritising employment opportunities.
Happiness and life satisfaction
Happiness and life satisfaction scores are crucial indicators of overall well-being. Cheltenham and Chelmsford have some of the highest happiness scores (7.73 and 7.79), paired with high life satisfaction (7.41 and 7.55). These towns offer a combination of economic opportunity and personal fulfilment.
Affordable living
Cities like Dudley and Barnsley offer affordable living conditions with lower rent percentages (17.31% and 18.76%) coupled with decent median salaries (£27,389 and £27,189). This makes them attractive for workers looking to maximise their disposable income.
Regional performance
The North West of England performs particularly well, with Chester, Warrington, and Preston all in the top five. These cities provide a good mix of salary, job opportunities, and quality of life. The Midlands also show strong performers with Stafford and Coventry in the top ranks.
High-cost locations
Cities like Oxford, Brighton and Hove, and Cambridge, while offering higher salaries (£31,475, £29,144, and £34,436 respectively), also have high rent percentages (24.78%, 24.99%, and 21.95%). This highlights the trade-off between high earnings and high living costs in these areas.
Notable mentions
Tunbridge Wells, despite having a relatively high commute time (27.7 minutes), maintains a strong position due to its high median salary (£32,674) and excellent life satisfaction score (7.74). Wigan, with the highest number of job vacancies per 10,000 people (3406.59), also merits attention for its vibrant job market.
Local responses to the research
Chester – #1
Councillor Nathan Pardoe, Cheshire West and Chester Council’s Cabinet Member for Inclusive Economy, Regeneration and Digital Transformation said:
“Chester is a well-established visitor destination, with a unique history, culture and heritage that attracts tourists and residents. I’m delighted that Chester has been named as the number one city for employees and job-seekers, the recognition is well-deserved for the city and the business community that helps it thrive.”
Associate Professor Kirstie Simpson, Dean of Chester Business School said: “We are rightly proud of our connections with Chester-based employers who contribute so much to the experience of our students. Our engagement with the business community has never been so strong and the positive outcome of this is high employment rates for our students and a fantastic local economy!”
Angela Standish, Head of Careers and Employability and Deputy Director of DASA (Directorate of Access, Skills, and Apprenticeships) at the University of Chester said:
“We are thrilled that Chester has been recognised as the top city for employers and jobseekers. This accolade is a testament to the concerted efforts of our community, businesses, and education institution to create an environment where individuals can thrive professionally and personally. The University if committed to supporting our students and graduates in achieving their career aspirations and provide high quality talent that aligns with the needs of the local job market whilst contributing to the overall well-being of our community”.
Dudley – #2
Sarah Moorhouse, CEO of Black Country Chamber of Commerce, said:
“The PayrollPrices.com report placing Dudley at number two […] provides a welcome opportunity to shine a light on a fact known locally in the borough but overlooked nationally, that there are fantastic opportunities offered by living in the Black Country region. […] With significant regeneration and development projects in the pipeline, 2025 is a promising time for people living in Dudley to see their surroundings improve. The extension of the Metro link with Birmingham and Wolverhampton and the planned interchange development will make Dudley more connected and open up new opportunities.”
Stafford – #4
Cllr Aidan Godfrey, Leader of Stafford Borough Council, said:
“We are seeing significant investment taking place in Stafford and this will lead to more employment opportunities and more places to live to support new jobs – so it is good to see this table showing us as one of the leaders in the country, and scoring well for high employee salaries and job opportunities, along with a lower percentage of that wage spent on renting in the area.”
Preston – #5
Mark Whittle, Director of Membership for North & Western Lancashire Chamber of Commerce and BID Manager, said:
“It’s pleasing to see that Preston is riding high in the list of ‘Best Towns and Cities’ as a result of the strong combination of job opportunities and quality of life, which are vital attributes. Preston is a friendly and welcoming city, that offers positive opportunities for all, whether that be through employment, investment, as a place to live, or simply as a visitor.”
Coventry – #6
Cllr Jim O’Boyle, Cabinet Member for Jobs, Regeneration and Climate Change, said:
“It is no surprise that Coventry has been identified as a great city for employees and job seekers. From services such as our Job Shop which supports people into finding work, to our innovative and exciting plans for green future projects which will create thousands of new jobs in the area, Coventry is a fantastic place to live and work.”
Sunderland – #9
John McCabe, chief executive at the North East Chamber of Commerce, said:
“This latest study by PayrollPrices.com, which places Sunderland in the top 10 cities in the UK for employees and job seekers, indicates the city is leading the way with its quality of life and employment opportunities.
“Sunderland is undergoing the most transformational city-wide regeneration programme in decades. Developments include Riverside Sunderland, International Advanced Manufacturing Park, and the Smart City project and next generation 5G mobile infrastructure rollout.
“The regeneration of Sunderland is helping make the whole of the North East a better place to live, work and play. It’s excellent to see the city getting the recognition it deserves in this latest survey, but it’s safe to say the best is yet to come.”
The data set in full
← Table scrolls horizontally →
| Rank | Location | Median salary £ | Median hours worked | Median commute time (mins) | Happiness score | Life satisfaction score | Job vacancies per 10,000 people | Rent (% of salary) |
|---|---|---|---|---|---|---|---|---|
| 1 | Chester | 29385 | 36.8 | 19.2 | 7.29 | 7.44 | 1393.17 | 17.68% |
| 2 | Dudley | 27389 | 37 | 18.65 | 7.49 | 7.44 | 2571.65 | 17.31% |
| 3 | Warrington | 30259 | 37 | 19.3 | 7.32 | 7.45 | 1583.76 | 17.73% |
| 4 | Stafford | 32764 | 37 | 20.2 | 7.08 | 7.2 | 2062.49 | 13.73% |
| 5 | Preston | 26752 | 37 | 18.15 | 7.79 | 7.38 | 1303.21 | 16.78% |
| 6 | Coventry | 29476 | 37 | 19.7 | 7.45 | 7.35 | 492.21 | 18.32% |
| 7 | Canterbury | 26534 | 35 | 20.25 | 7.37 | 7.46 | 947.00 | 19.67% |
| 8 | Southend-on-Sea | 31923 | 36.9 | 20.85 | 7.31 | 7.36 | 583.14 | 18.80% |
| 9 | Sunderland | 25333 | 37 | 16.45 | 7.33 | 7.3 | 515.05 | 18.71% |
| 10 | Chelmsford | 30512 | 35 | 23.4 | 7.79 | 7.55 | 1323.39 | 20.65% |
| 11 | Cheltenham | 31067 | 36.8 | 16.7 | 7.73 | 7.41 | 549.08 | 19.70% |
| 12 | Stirling | 30774 | 35 | 19.15 | 7.57 | 7.56 | 787.34 | 19.50% |
| 13 | Blackburn with Darwen | 25476 | 37 | 18 | 7.43 | 7.24 | 1591.29 | 17.33% |
| 14 | Doncaster | 27772 | 37.5 | 18.9 | 7.59 | 7.49 | 1201.76 | 18.71% |
| 15 | Tunbridge Wells | 32674 | 37 | 27.7 | 7.43 | 7.74 | 1312.06 | 19.76% |
| 16 | Wigan | 28246 | 37 | 19.3 | 7.3 | 7.59 | 3406.59 | 20.26% |
| 17 | Barnsley | 27189 | 37 | 20.25 | 7.29 | 7.37 | 2217.35 | 18.76% |
| 18 | Stevenage | 28136 | 37 | 20.2 | 7.21 | 7.42 | 1842.07 | 19.19% |
| 19 | Darlington | 27282 | 37 | 15.5 | 7.17 | 7.32 | 534.97 | 14.30% |
| 20 | Wolverhampton | 26282 | 37.5 | 19.75 | 7.49 | 7.25 | 626.51 | 14.84% |
| 21 | Colchester | 29978 | 36.5 | 21.2 | 7.56 | 7.78 | 523.86 | 20.94% |
| 22 | Ashford | 29344 | 37.5 | 18.6 | 7.57 | 7.31 | 758.34 | 20.32% |
| 23 | Bedford | 31021 | 37 | 19.75 | 7.59 | 7.46 | 989.77 | 22.24% |
| 24 | Wakefield | 26423 | 37 | 19.65 | 7.17 | 7.39 | 1618.06 | 19.66% |
| 25 | Wrexham | 27711 | 37 | 15.85 | 7.39 | 7.53 | 636.86 | 21.65% |
| 26 | Ipswich | 28657 | 37 | 18.1 | 7.21 | 7.62 | 353.45 | 19.26% |
| 27 | York | 28592 | 37 | 20.6 | 7.45 | 7.57 | 607.05 | 20.78% |
| 28 | Oxford | 31475 | 36.8 | 20.5 | 7.56 | 7.8 | 604.08 | 24.78% |
| 29 | Bournemouth | 28805 | 37 | 17.5 | 7.37 | 7.57 | 373.83 | 20.62% |
| 30 | North Tyneside | 28097 | 37 | 20.25 | 7.47 | 7.51 | 342.36 | 19.01% |
| 31 | Milton Keynes | 31745 | 37 | 14.05 | 7.4 | 7.51 | 529.49 | 24.57% |
| 32 | Bath | 29451 | 36 | 18.85 | 7.2 | 7.38 | 1226.30 | 24.45% |
| 33 | Reading | 29927 | 37 | 21.1 | 7.42 | 7.43 | 953.31 | 22.78% |
| 34 | Hartlepool | 25859 | 37 | 17.5 | 7.57 | 7.29 | 723.34 | 20.88% |
| 35 | Falkirk | 30316 | 37 | 19.15 | 7.45 | 7.62 | 704.85 | 25.73% |
| 36 | Liverpool | 28289 | 36.9 | 19.1 | 7.34 | 7.1 | 281.64 | 18.20% |
| 37 | Leeds | 29000 | 37 | 21.65 | 7.28 | 7.46 | 249.44 | 18.21% |
| 38 | Plymouth | 26820 | 36.9 | 17.2 | 7.71 | 7.45 | 97.73 | 19.51% |
| 39 | Medway | 30091 | 37.4 | 23.25 | 7.29 | 7.29 | 614.57 | 19.34% |
| 40 | Sheffield | 28373 | 37 | 20.45 | 7.33 | 7.28 | 230.27 | 16.92% |
| 41 | Slough | 33370 | 37.5 | 23.95 | 7.4 | 7.25 | 3674.75 | 23.37% |
| 42 | Mansfield | 25437 | 37.1 | 18.9 | 7.4 | 7.18 | 1953.03 | 21.46% |
| 43 | Newcastle upon Tyne | 28044 | 36.9 | 18.2 | 7.28 | 7.5 | 256.84 | 20.03% |
| 44 | Aberdeen | 29958 | 36.8 | 18.5 | 7.49 | 7.35 | 84.29 | 19.75% |
| 45 | Middlesbrough | 25079 | 37 | 17.85 | 7.05 | 7.35 | 337.62 | 17.61% |
| 46 | Bradford | 26216 | 36.9 | 19.95 | 7.24 | 7.2 | 400.81 | 18.31% |
| 47 | Gateshead | 26384 | 37 | 19.95 | 7.36 | 7.35 | 659.44 | 20.69% |
| 48 | Swindon | 31683 | 37.5 | 18.8 | 7.43 | 7.43 | 341.63 | 20.83% |
| 49 | Derby | 28442 | 37.4 | 20.35 | 7.28 | 7.36 | 449.61 | 18.99% |
| 50 | Stoke-on-Trent | 25975 | 37 | 19.35 | 7.32 | 7.16 | 292.56 | 17.79% |
| 51 | Crawley | 29348 | 37.3 | 25.15 | 7.04 | 7.59 | 1970.63 | 24.53% |
| 52 | Portsmouth | 28573 | 37 | 18.15 | 7.37 | 7.38 | 435.95 | 22.05% |
| 53 | Luton | 27362 | 37 | 21.4 | 7.64 | 7.3 | 711.62 | 23.02% |
| 54 | Dumfries and Galloway | 25893 | 35.9 | 11.7 | 7.63 | 7.66 | 60.49 | 22.01% |
| 55 | Gloucester | 27653 | 37.4 | 18.3 | 7.38 | 7.44 | 582.85 | 22.78% |
| 56 | Belfast | 29393 | 36.9 | 38.9 | 7.8 | 7.7 | 123.94 | 21.11% |
| 57 | Leicester | 24245 | 37 | 19.6 | 7.24 | 7.36 | 321.41 | 19.30% |
| 58 | Bridgend | 27439 | 37 | 22.6 | 7.72 | 7.49 | 405.69 | 22.00% |
| 59 | Lincoln | 27228 | 37 | 17.95 | 6.57 | 6.7 | 336.95 | 19.17% |
| 60 | Kingston upon Hull | 25396 | 37 | 18.15 | 7.32 | 7.38 | 127.80 | 20.46% |
| 61 | Southampton | 28539 | 37 | 18.7 | 7.07 | 7.23 | 458.06 | 22.08% |
| 62 | Birmingham | 27175 | 37 | 21.05 | 7.18 | 7.24 | 158.20 | 18.77% |
| 63 | Peterborough | 28123 | 37.4 | 14.05 | 7.14 | 7.25 | 259.96 | 20.27% |
| 64 | Blackpool | 23506 | 37 | 17.4 | 7.31 | 7.49 | 472.87 | 25.53% |
| 65 | Manchester | 27217 | 36.8 | 19.65 | 6.85 | 6.97 | 479.59 | 21.82% |
| 66 | Brighton and Hove | 29144 | 35 | 18.2 | 7.03 | 7.39 | 337.96 | 24.99% |
| 67 | Swansea | 27010 | 36.9 | 17.8 | 7.34 | 7.47 | 114.49 | 22.21% |
| 68 | Cambridge | 34436 | 37 | 22.3 | 7.02 | 6.46 | 471.32 | 21.95% |
| 69 | Hastings | 25897 | 37 | 15.5 | 6.56 | 6.93 | 452.84 | 20.85% |
| 70 | Worthing | 30542 | 37.3 | 18.85 | 7.02 | 6.97 | 803.71 | 26.52% |
| 71 | Exeter | 27397 | 36.8 | 18.55 | 7.34 | 7.36 | 355.38 | 26.59% |
| 72 | Bristol | 30867 | 36.2 | 21.6 | 7.2 | 7.31 | 307.49 | 23.13% |
| 73 | Edinburgh | 32240 | 36 | 20.65 | 7.25 | 7.69 | 126.81 | 25.68% |
| 74 | Eastbourne | 29060 | 37 | 20.35 | 6.57 | 6.68 | 597.60 | 22.38% |
| 75 | Norwich | 28456 | 37 | 20 | 7.07 | 7.3 | 196.74 | 21.09% |
| 76 | Cardiff | 30230 | 35.9 | 19.35 | 7.1 | 7.15 | 228.82 | 24.93% |
| 77 | Dundee | 27247 | 36.9 | 15.2 | 7.04 | 7.4 | 133.29 | 26.42% |
| 78 | Nottingham | 23377 | 37 | 22.9 | 7.24 | 7.24 | 419.03 | 23.25% |
| 79 | Glasgow | 28836 | 35 | 19.8 | 7.14 | 7.24 | 124.24 | 24.97% |
| 80 | London | 44370 | 37.2 | 38 | 7.46 | 7.3 | 72.94 | 26.91% |